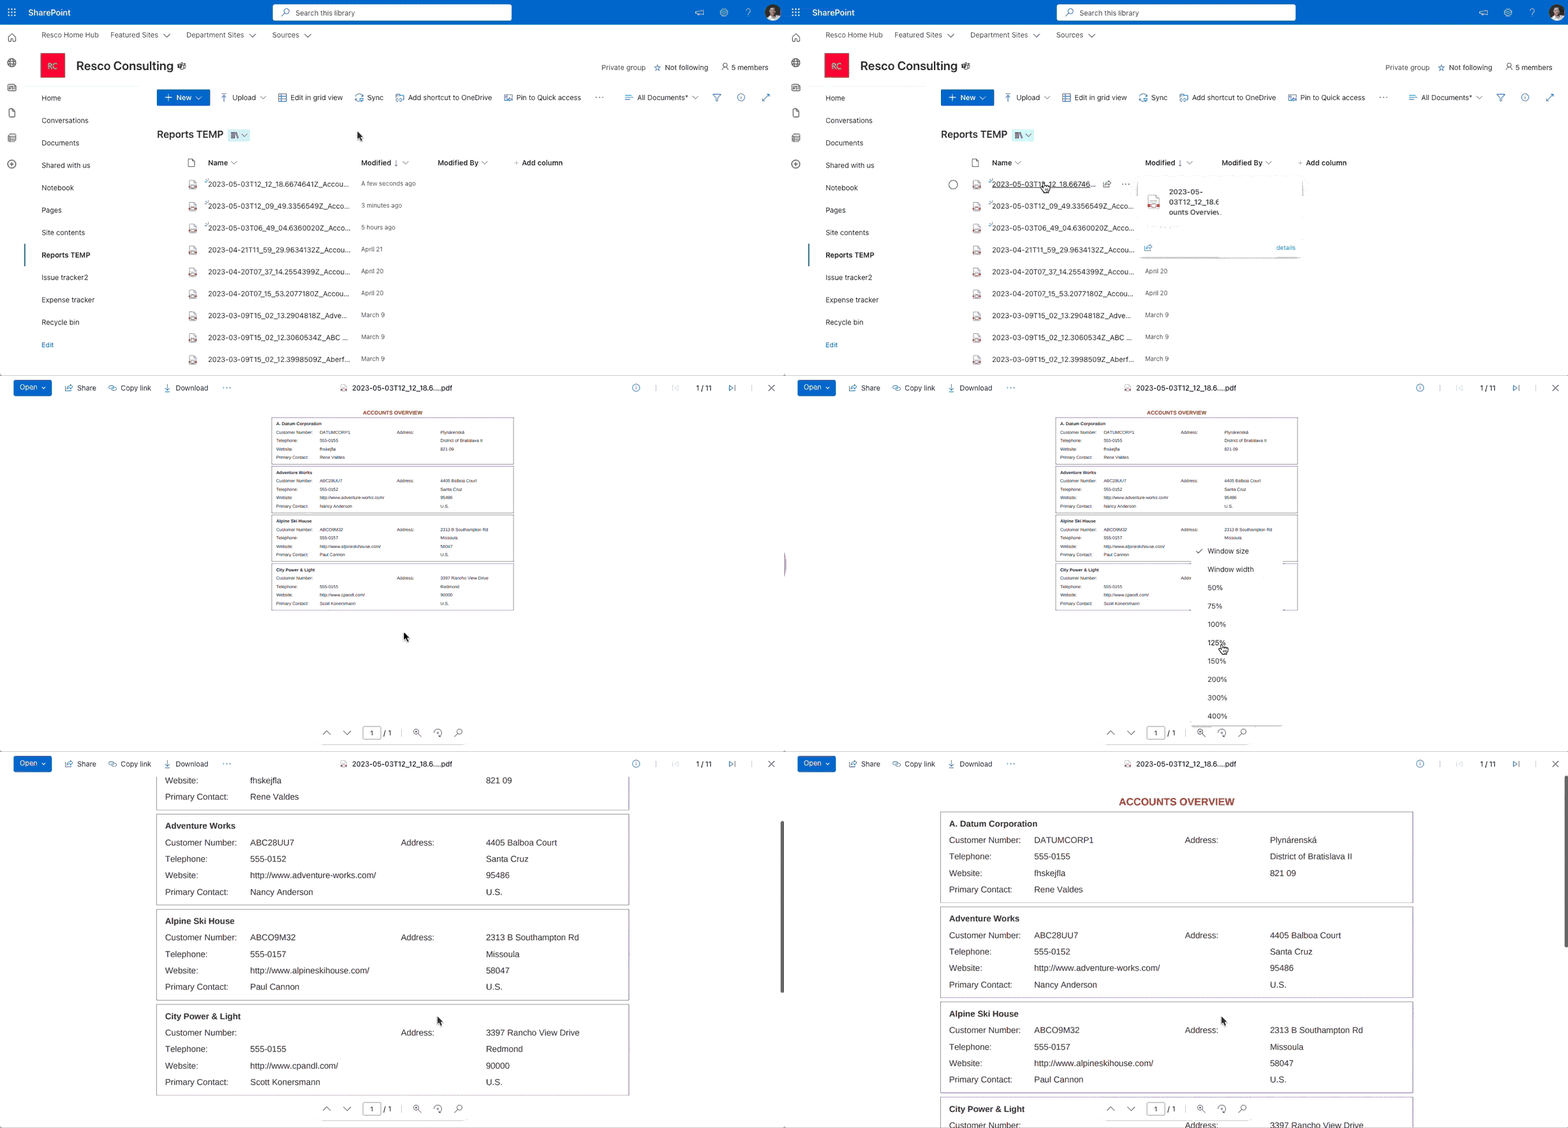
This blog describes how to use Resco Reports connector to generate a PDF report based on data from multiple rows selected in Dynamics 365 table view.
Throughout the guide, you will also learn how to automatically save the report to a specific SharePoint location.
It is going to be a little technical, but the reward is worth it, so let’s dive right in.
What scenario you can cover with this flow
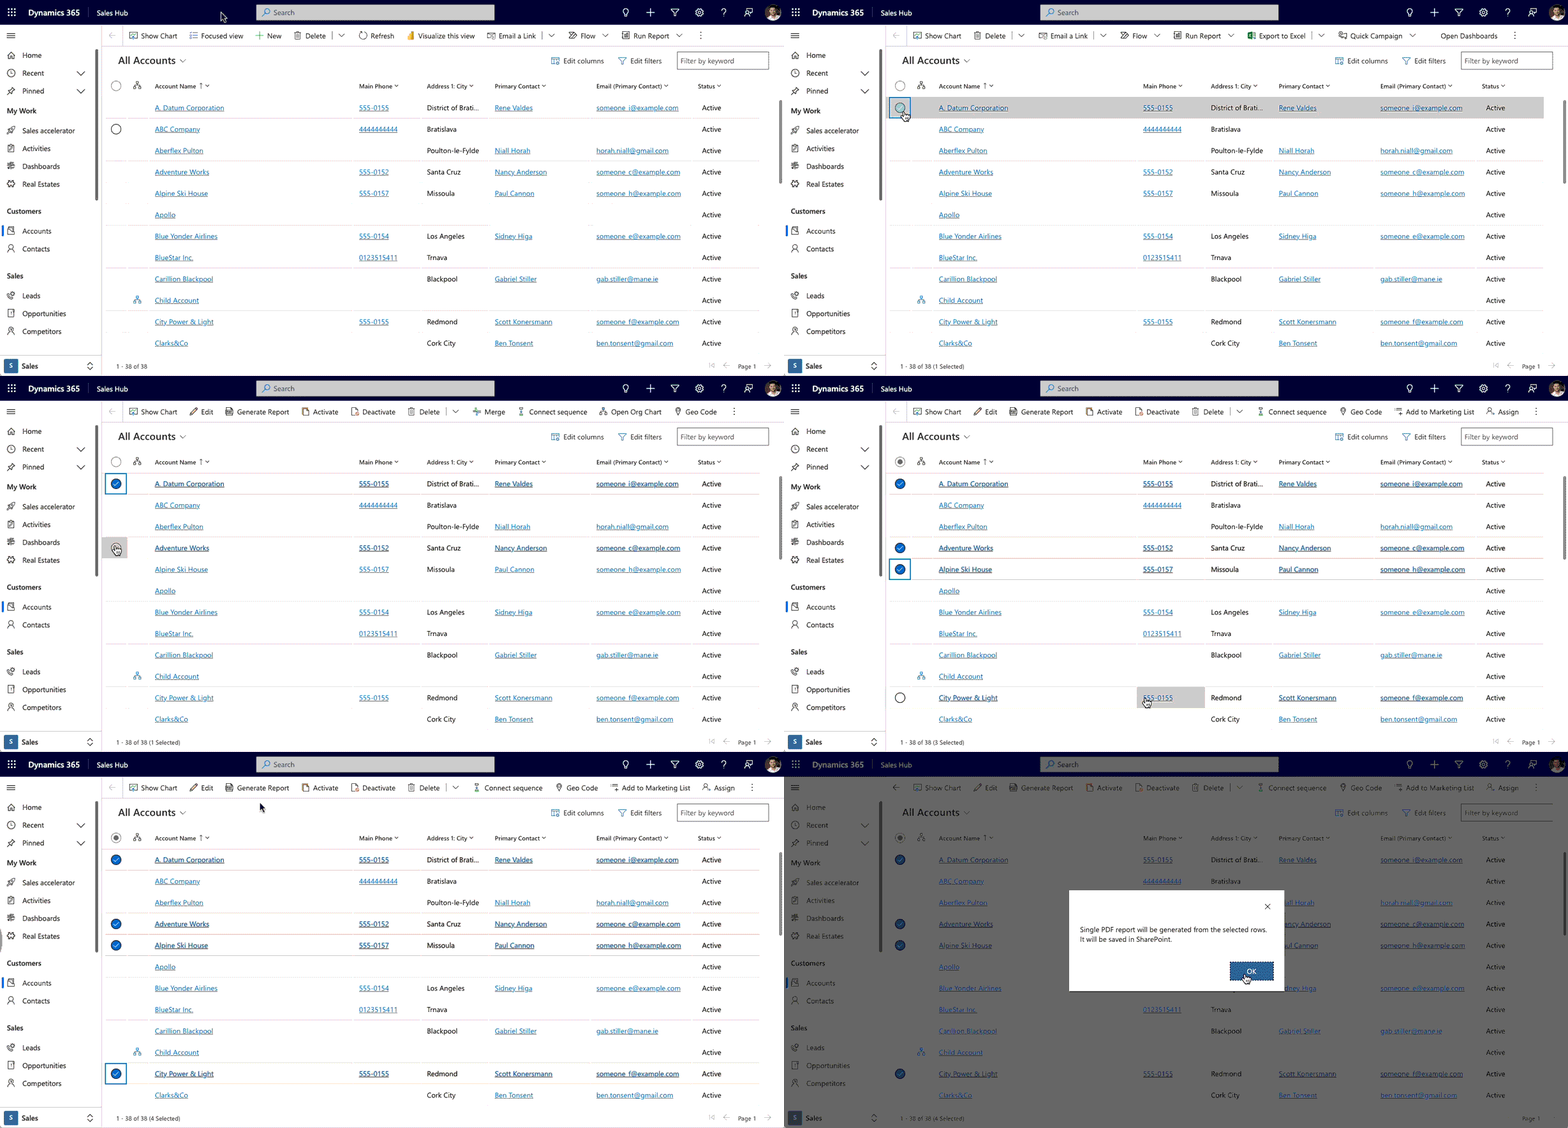
Back-office user manually selects any number of rows in Account table. Then clicks on “Generate Report button” and Accounts Overview PDF is automatically generated and saved on SharePoint.
Prerequisites
- The setup can be done only by an admin
- Report Template is created in the organization
- You have these licenses:
- Power Automate license for the admin
- Resco license
- Dataverse Admin License
Step 1: Create a new flow and a trigger
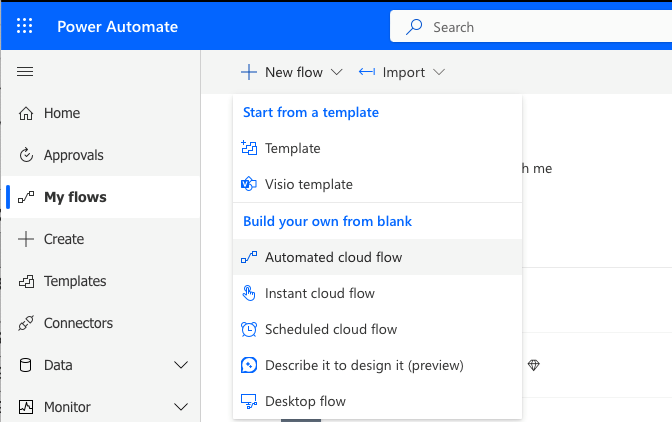
First, go to make.poweautomate.com and click on the “New flow” and “Automated cloud flow” options.
You can name your flow now or just click on “Skip” (you can name it later).
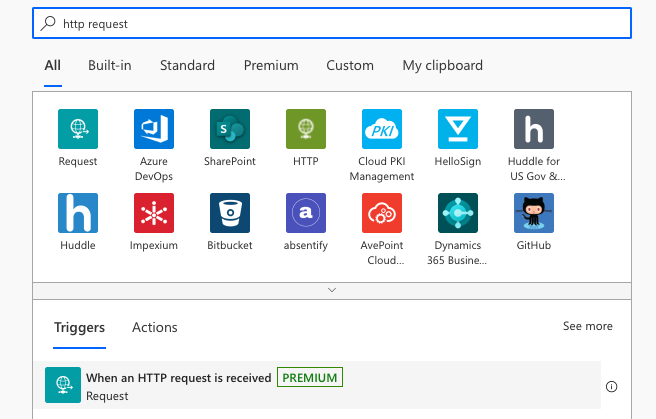
For a trigger, enter “http request” into the search bar and choose the “When an HTTP request is received” option.
For a Request Body JSON Schema, insert this JSON:
{
“type”: “object”,
“properties”: {
“GUIDS”: {
“type”: “string”
}
}
}
The provided JSON is a representation of an object with one property called “GUIDS”.
Within the code, we define what this trigger should expect to receive from the button we’ll create later in PowerApps.
Let’s break it down further:
“type” & “object”: This indicates that the root element of the JSON is an object.
“properties”: This keyword is used to define the properties of the object.
“GUIDS”: This is the name of the property. In this case, it represents a globally unique identifier (GUID).
“type” & “string”: This specifies that the value of the “GUIDS” property should be a string. A string is a sequence of characters, such as letters, numbers, and symbols.
Step 2: Create a variable
The next step we will need is a variable. Go ahead and click “Next step” and search for an “Initialize variable”.
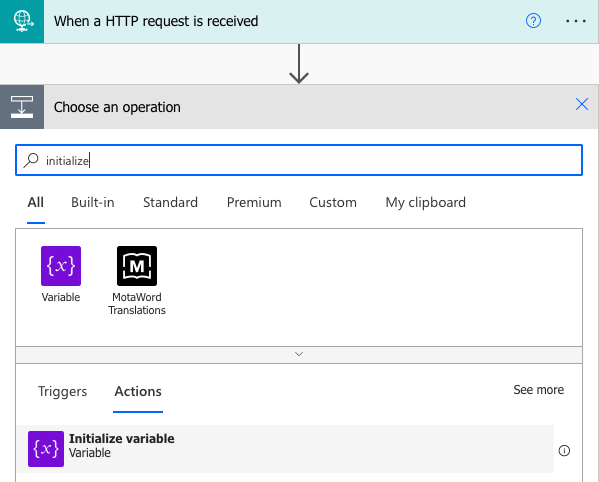
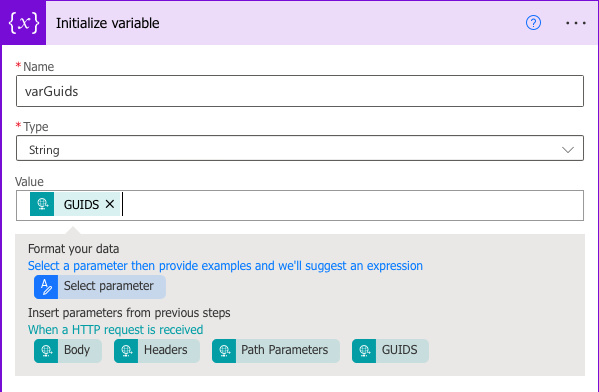
Select an appropriate name for the variable. In this case, we are going to name it “varGuids”, select its Type as “String” and Value is going to be “GUIDS” from previous step/trigger.
Your variable should look like this:
Step 3: Compose – edit format of GUIDS
Right now, we have received our GUIDS of records we selected in the view.
The only thing that keeps us from using a Resco Reports connector in our flow now is that the connector expects those GUIDS to be in the slightly different format – in comma-delimited list of record IDs.
That’s why our next action is a step called “Compose”, where we take those GUIDS and use an action to get a subset of characters of a given string.
Click on “Add new action” search for “Compose” action, then click on “Inputs”, switch to “Expressions” and start typing function called substring.
Add the () after the function, switch to “Dynamic content” and choose the variable “varGuids”.
Add “1” after the variable, and add another function called “sub()”, where we define the length of substring. In the () add another function called “length()” and inside of () there will be our varGuids variable again.
After this, just add “2”.
The whole expression should look like this:
substring(variables(‘varGuids’),1,sub(length(variables(‘varGuids’)),2))
Step 4: Resco connector – the star of the show
When we got this out of the way, we can now proceed to adding Resco Reports connector as an action.
Type in “Resco Reports” to the search bar and choose the “Generate a report on multiple rows” action.
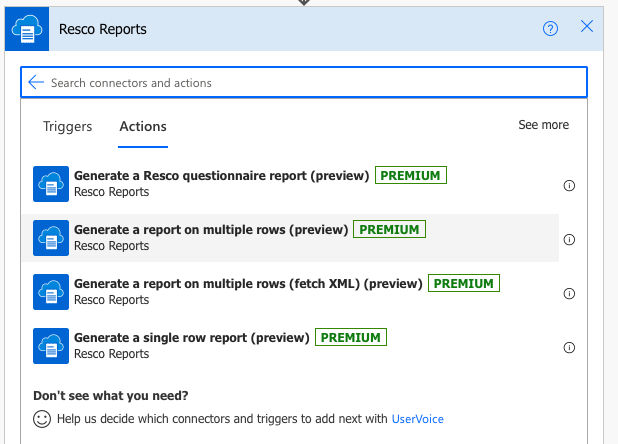
You might be asked to provide you Dataverse resource URL, please do so.
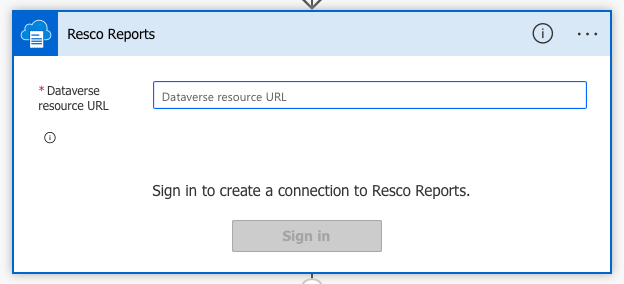
After you provided you Dataverse URL, you can now setup Resco Reports action.
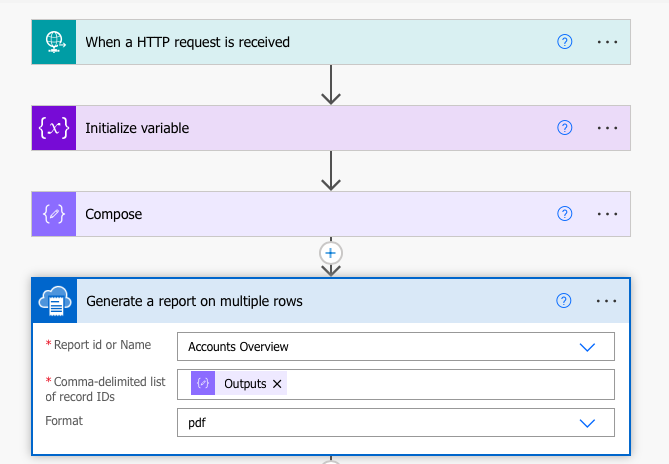
In Report ID, choose the correct Report from your organization that you defined in Report Designer.
In this case, it has to be a report for list of records.
For the comma-delimited list of record IDs, choose “Outputs” from the “Compose” action, and then your preferred format. You can chose PDF, HTML, Word or Excel.
The action should look something like this:
Step 5: SharePoint configuration
The next action we need to do is to create a file in SharePoint.
Type in “Create a file” and choose the action related to SharePoint.
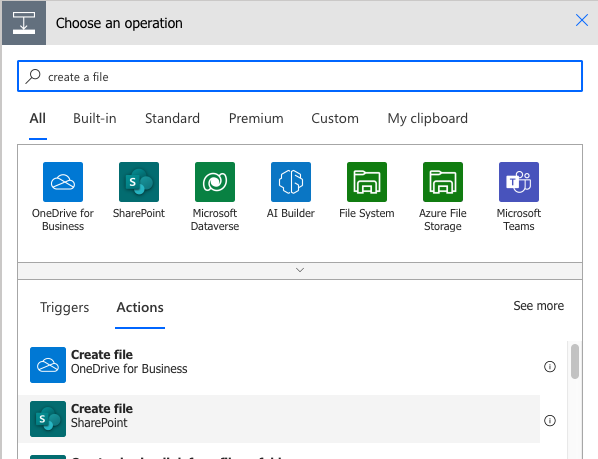
In this step, you will define your SharePoint site and the folder path from your site. You can set up a file name as well.
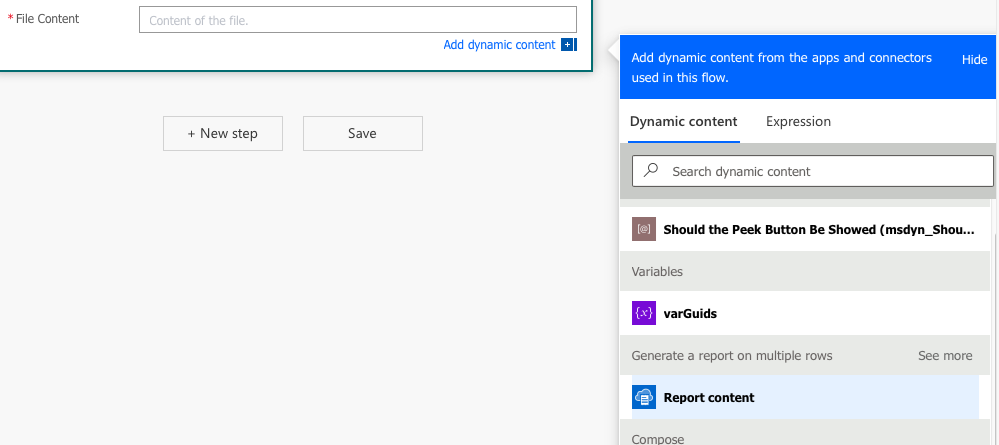
The only thing that you must have the same as in our example is the file content. Choose the “Report content” option from the “Generate a report on multiple row” step in our flow.
The step should look like this:
And now you have it. You can now select multiple records on the list view, click the button, and your report for those records will be generated and saved to your SharePoint site.
Step 6: Create and define the button
We have successfully created a flow, all we need to do now is to add a button to the view.
Navigate to the make.powerapps.com again, go to the “Solutions” and choose a solution you want to add a button in. Click on three dots and hit “Edit”.
Create a JS file in your computer with this script:
function GenerateReport(selectedIds) {
var formattedGuids = “{” + selectedIds + “}”;
var req = new XMLHttpRequest();
var url = “[INSERT URL OF YOUR FLOW HERE]“;
req.open(“POST”, url, true);
req.setRequestHeader(‘Content-Type’, ‘application/json’);
req.send(JSON.stringify({
“GUIDS”: formattedGuids}));
Xrm.Utility.alertDialog(“Single PDF report will be generated from the selected rows. It will be saved in SharePoint.”);
}
Do not forget to paste you flow URL from the trigger of the flow.
The next thing we want to do is to create a web resource, which we will use in the configuration of the button on the list view. Click on “New”, then select “More” and “Web resource”.
Choose the JS file we created earlier, type in the Display name. Type should be automatically changed to JavaScript (JS). Click “Save”.
Navigate to the apps, choose the app you want to add a button in and click on “Edit”.
Find a view where you want to place your button, click on three dots and then on “Edit command bar”.
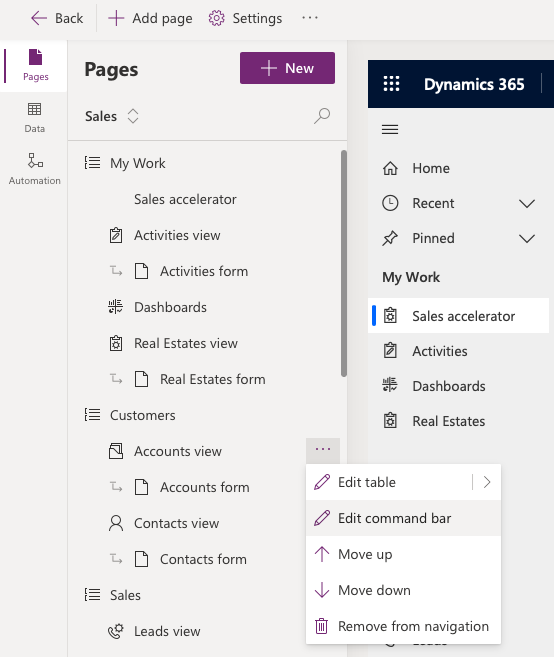
Select the main grid and click on “Edit”.
On the upper left side, click on “+New” and choose “Command”.
The next settings for button are up to you, but here are some examples:
- For the label, type in “Generate Report”.
- For Icon, choose “Use Icon” and “PdfIconFile”.
Important part about configuring the command starts here:
For the Action, select “Run JavaScript”, for the Library, choose the JS file that we added to a WebResourse.
Next, type in the name of the function from the JavaScript web resource, in this case “GenerateReport”.
Click on “Add parameter” and choose “SelectedControlSelectedItemsIds” from a dropdown list.
Since it’s a button for generating a report for multiple records, we don’t want it to be visible unless at least one item is selected on the list.
Therefore, for a visibility, click on the dropdown, and select “Show on condition from formula” and then click on “Open formula bar”.
Paste following function to a formula bar:
CountRows(Self.Selected.AllItems)>0
Make sure to Save and Publish it.
How to get in touch
And that’s a wrap! In this blog, we demonstrated how to create a flow, which generates the Resco Report for multiple records in your Dataverse org and saves this report in your SharePoint.
You can trigger this flow by clicking on your custom button.
If you want to learn more, or have any questions, please do not hesitate to contact me and I’ll be happy to follow up.
