Fieldworkers rely on good tools for data collection, and Resco’s Inspections+ and Forms+ are the go-to solutions. But the real challenge isn’t just gathering data – it’s making sense of it.
Thanks to our partnership with Microsoft, we’ve made this process straightforward. By integrating Resco’s data collection with Microsoft’s visualization tools, we’ve created a streamlined solution for businesses to harness their data effectively.
This guide breaks down the steps for using Power BI to not just view but truly understand your questionnaire responses. It’s time to move beyond the basics of data collection and tap into the full potential of your information with the power of Power BI.
Use case: Working with questionnaires in Power BI
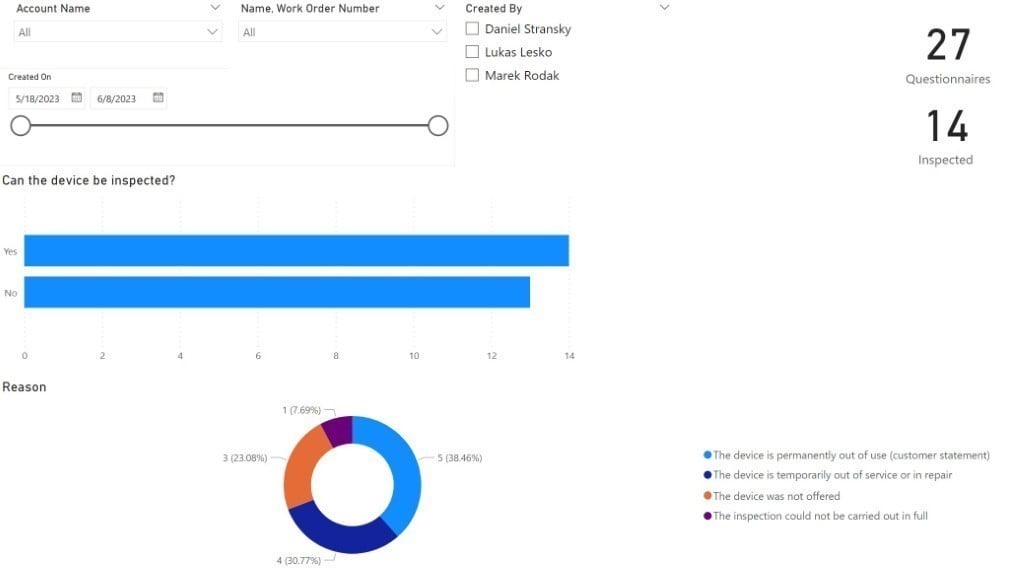
Using sample data from elevator inspections, we create visual reports to identify patterns.
For instance, filtering inspections by account reveals variations in problematic accounts. Those variations include:
- Asset-specific insights, like identifying recurring issues with specific elevator brand component.
- Analyzing specific time frames, such as comparing season to season.
- Asking why we did fewer inspections this season compared to others
- Visualizing meaningful data to offer valuable insights.
Technical integration
Importing data into Power BI Desktop: Data extraction
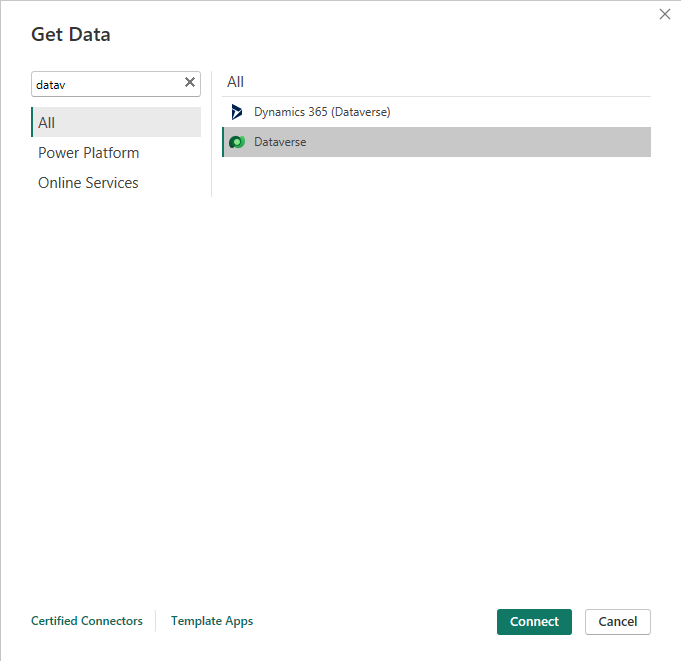
Let’s start with the actual report. Begin by importing data from your backend using the “Get Data” option. This connection serves as the foundation for your Power BI report, allowing you to pull in data from sources like Dataverse or Salesforce.
Entity selection
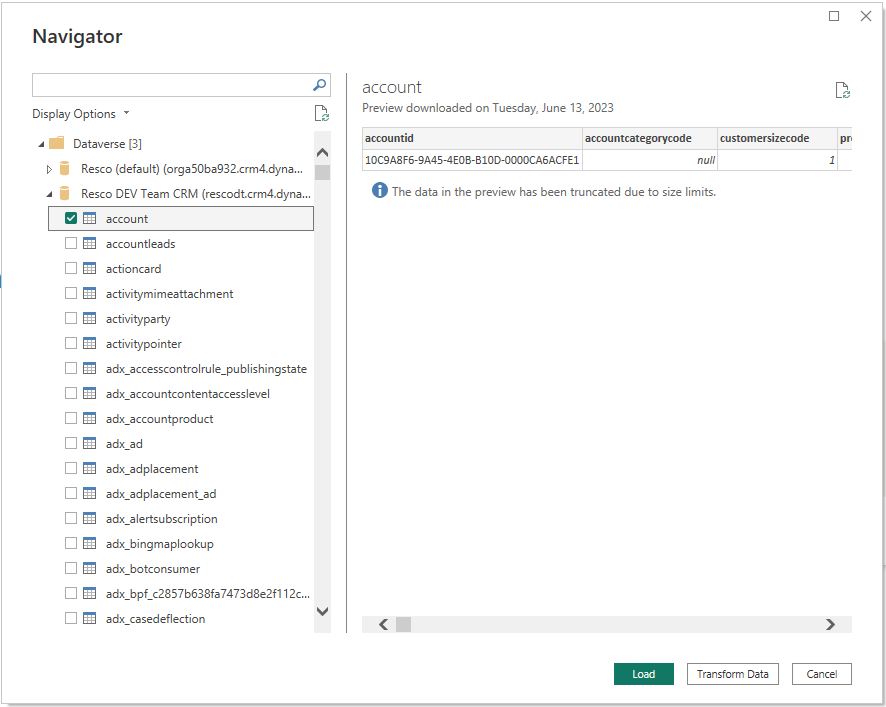
You don’t have to import the whole organization. Select only the relevant entities that you intend to visualize in your report. Once you have selected all the entities that you need, click Transform data. This imports the entities and starts Power Query Editor right away.
Data transformation and cleaning
Data refinement
Use the Power Query Editor to clean up your data. This involves removing unnecessary columns and shaping the data to match your reporting needs. In this use case, unnecessary columns can be questionnaires we don’t want to visualize or questionnaires with serialized answers columns that are empty. Cleaning your data ensures that only essential information is included in your report.
Parsing JSON
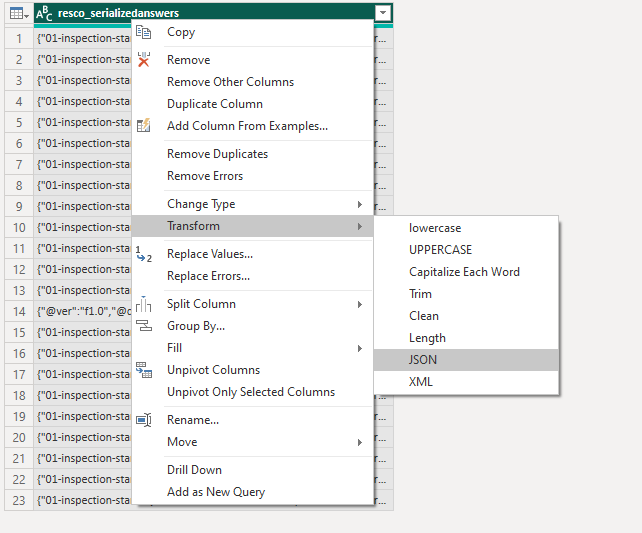
After you are finished with data cleaning, create a new query (table) that contains only the questionnaires you want to visualize. Remove all but the serialized answers column (containing questionnaire responses in JSON) and transform (parse) it. This step is crucial for isolating the key columns that hold the answers you want to visualize.
Managing relationship model
Defining relationships
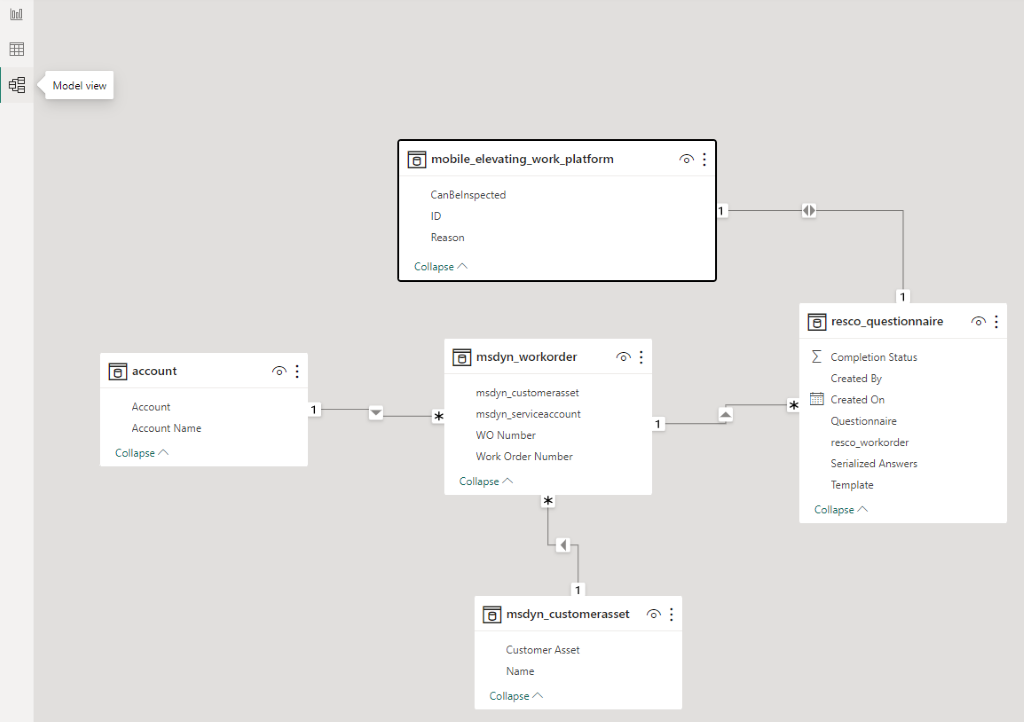
The Model View is used to set relationships between various tables in the report. That includes a newly created table, like the one where we’ve transformed questionnaire data. Establish relationships between the different tables in your dataset. These relationships create a unified data structure, allowing you to connect and analyze data across various entities.
Building the report (final step)
Creating visualizations
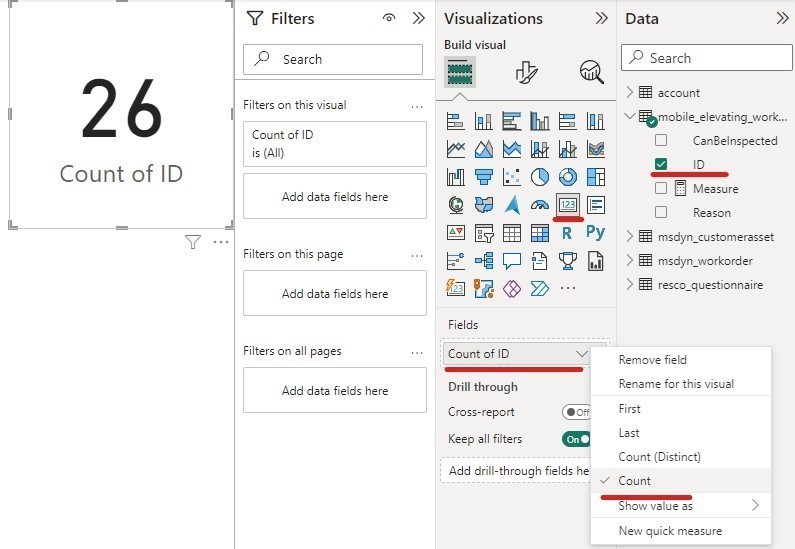
In this phase, your data is ready to be visualized. Pick visualizations that convey your data insights the best. You can choose from many visualization types. Here is one of the most basic: A card displaying the number of questionnaires collected. You can modify each visualization by editing properties, adding filters, etc.
Key takeaways
- Resco’s Inspections+ and Forms+ are essential for precise data collection, answering the challenge to derive meaningful insights from massed data
- Our collaboration with Microsoft enhances this process by integrating Resco’s data collection with Microsoft’s visualization tools, providing a streamlined solution for businesses.
- This guide briefly explores displaying and interpreting questionnaire responses with Power BI, unlocking your data’s full potential.
- In our use case, working with questionnaires in Power BI unveils patterns and valuable insights for decision-making based on actual figures.
Conclusion
Efficiently transforming questionnaire responses into a robust Power BI report empowers data-driven decisions and becomes a catalyst for knowledge acquisition, strategically equipping field workers for inspections and enhancing overall efficiency. This is how data visualization transforms the mobile workforce.
Explore more with a Power BI deep dive on the Wiki.
